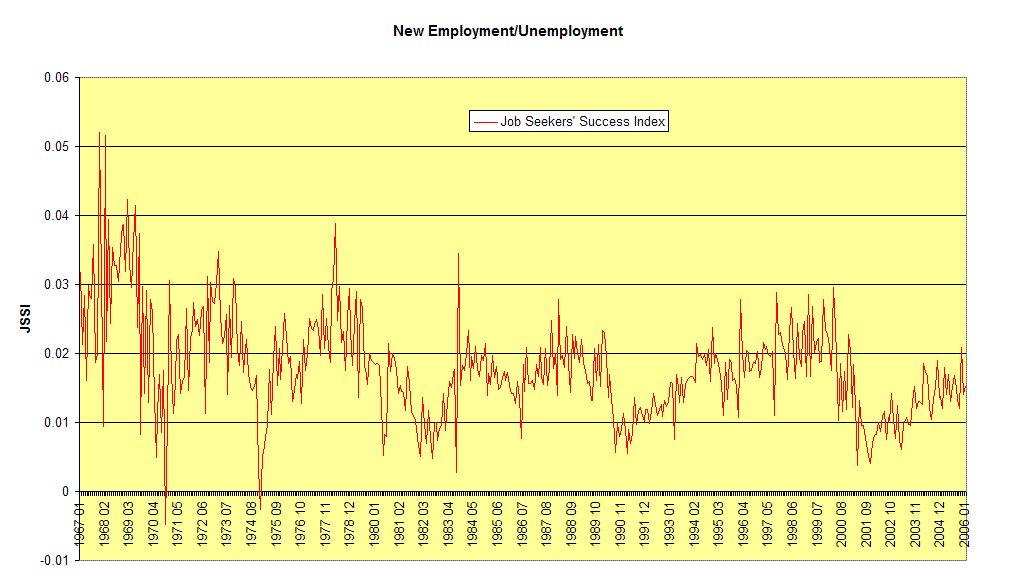
The JSSI has a sawtooth pattern, but underneath that it seems to be in a long-term decline. That decline should be reflected in increasing spells of unemployment, and (though the spike around 1983 makes it somewhat difficult to detect), it appears that the prediction is borne out:

On the other hand, the JII™ may drop below 0.002 (fewer than one of five hundred employed people losing his job and filing for unemployment in any given week) this month for the first time since the beginning of economagic's initial jobless claims time series in 1967.
The upshot is that there appears to be a pair of long-term trends at work - jobs are getting more secure for those who are employed, but more difficult to find for those who are not.
4 comments:
FA - In terms of production jobs - "manufacturing" - it doesn't matter. Total production jobs appear to have dropped by some 20% since 2000, according to the BLS numbers.
Between CAD, CNC and robotics actual production continues to climb while production employment continues to fall. It makes the productivity numbers look great (and they really are, it's no illusion) but I'm not sure that "we" are doing a sufficient job in getting the message through to youngsters that although math is hard, starvation ain't easy.
My compliments, again, Morgan. The discrepancy showing up in the tail of that chart is very interesting.
Where you are at makes a difference too. A lot of people have to get pretty creative when it comes to work when they live in areas that just are not as affluent.
This is very interesting but requires further investigation. We don't know what the causes are; we don't even really know what the effects are here. Somebody should really look into this seriously to see if they could tease the real causes out of the data.
MHA: I know. That's the case with all these things - slap some numbers together, see something interesting, wonder "why?". It was the same thing with my supposition that people own more "return producing assets" in the post on the savings rate.
But serious analysis requires serious time, and that's something I just don't have. I can only hope that someone takes up the gauntlet and runs with it.
There is an interesting anomaly that I think requires explanation, though, and that may be within my limits. It would seem to me that if the JSSI is about .02, it would take in the range of 1/0.02 = 50 weeks for an unemployed person to find a new job (actually, my off-the-cuff calculations indicate the median would be about 35 weeks and the mean about 82 weeks, but that is subject to the unrealistic assumption that the unemployed are all equally likely to become re-employed in any given week).
But neither the mean nor the median unemployment spells are anything like that.
So either I've constructed a junk statistic (sigh), or there is a lot of explaining to be done.
On possible explanation often given by the economic catastrophists that there are huge numbers of people who have simply given up looking for work, and so aren't counted as unemployed, but "discouraged" workers are counted by the BLS household survey, and they are relatively few in relation to those listed as unemployed.
If I have a eureka moment, I'll let you know.
Post a Comment